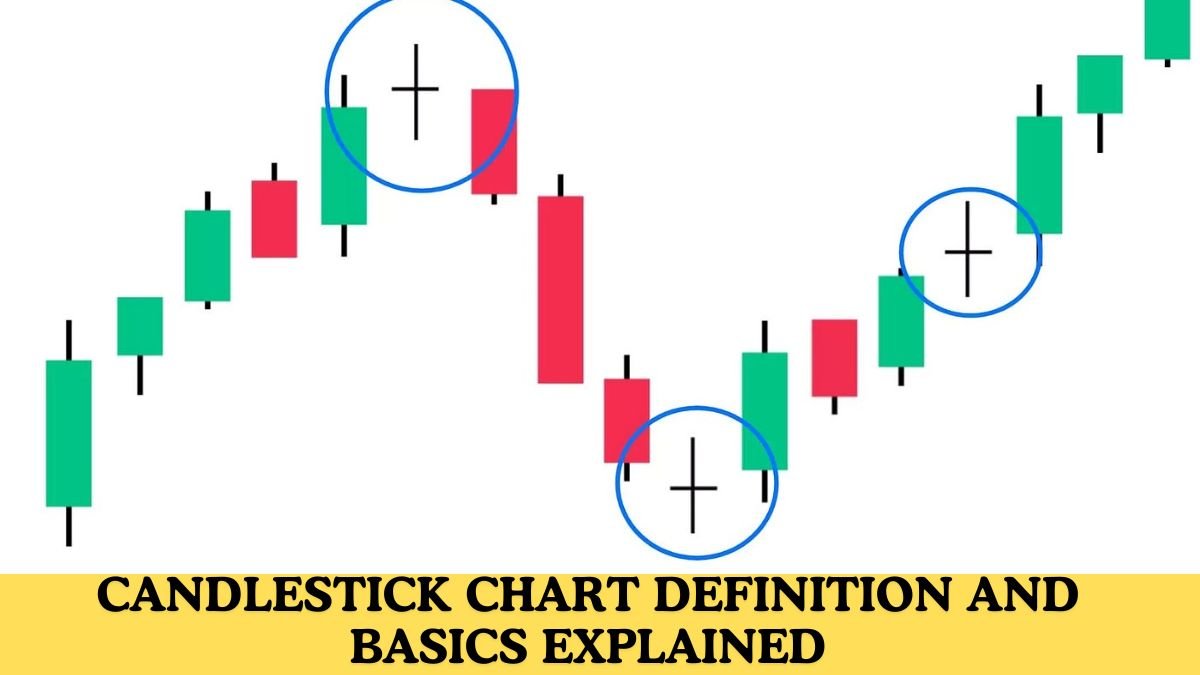
Candlestick Chart: Friends, if you are even slightly interested in the stock market, then you must have heard about the candlestick chart at some time or another. Let us tell you that the candlestick chart is a popular charting method in the stock market that is mainly used to understand the price movement and momentum in financial markets, such as the stock market, forex, and cryptocurrency. Japanese traders first used this chart in the 18th century, and since then, it has become a very important tool for traders and investors.
What is a candlestick chart?
Candlestick charts are basically a type of chart that uses candles to show the difference or change in the price of an asset over some time. Each candle in a candlestick chart represents the change in the minimum, opening, and closing price over a specified period (such as a day, an hour, or a minute).
Components of candlestick
Let us tell you that every candle in the candlestick chart can be divided into two parts
- (Body): This part of the candle shows the distance between the opening and closing price
- If the colour of any candle is green or white, then it means that the closing price of the asset was higher than the opening price; in other words we call it a bullish Candle)
- If the colour of any candle is red or black, then it means that the closing price was lower than the opening price, which we know as (Bearish Candle)
- (Wicks or Shadows): The thin part above and below the body is called wicks or shadows, which show the highest and lowest price of the asset.
Importance of Candlestick Chart
Using candlestick charts, we get to see many unique features, and at the same time, it also provides a lot of information to the traders
- Trend direction: Using candlestick charts, we can tell from the colour and changing shape of the candles whether the market is in a bullish or bearish trend.
- Market sentiment: Large-bodied candles in candlestick charts are a clear indicator of significant price movement, empowering us to make perceptive trading decisions, while small-bodied candles signal stability.
- Support and resistance: Candlestick charts have some important and special candle patterns that help us identify support and resistance levels.
Common Candlestick Patterns
In candlestick chart patterns, we get to see some major patterns which work as indicators for traders in the market:
- Doji: This is a type of candle whose opening and closing prices are normal. This candle basically indicates uncertainty in the market.
- Hammer: This candle pattern is a bullish reversal pattern with a short body and long lower wicks.
- Shooting Star: This is a bearish reversal pattern with a long upper wick and short body, which we rarely see in candle patterns
FAQs-Candlestick
Candlestick charts are basically a type of chart that uses candles to show the difference or change in the price of an asset over some time.
Candlestick charts are a popular charting method used primarily to understand price movement and momentum in financial markets, such as the stock market, forex, and cryptocurrencies. Japanese traders first used this chart in the 18th century
The thin lines above and below the body are called wicks or shadows, and they represent the highest and lowest prices of the asset.

My name is Chirag Suthar, and I have been blogging for the last five years. Every day, I share the latest articles on my blog with all my users. On Groww Stock, I will provide you with all the information related to finance.


1 thought on “Candlestick Chart Definition and Basics Explained”